

4 Tips for Teaching Data Analysis Before State Testing
By Mosa Mack Science Team
California's state science test puts serious emphasis on students' ability to analyze data—and for good reason. Data literacy matters in higher ed, the workforce, and everyday life. But when it comes to helping teachers prepare students, support can be hard to find. Here's how to build data analysis skills all year long.
1. Introduce Data Analysis as a Skill Worth Naming
Early in the year, teachers spotlight core practices like lab safety and claim-evidence-reasoning. Give data analysis that same treatment. Open students' eyes to the raw data all around them—from weather patterns to disease tracking—and present analysis as a tool for making meaning.
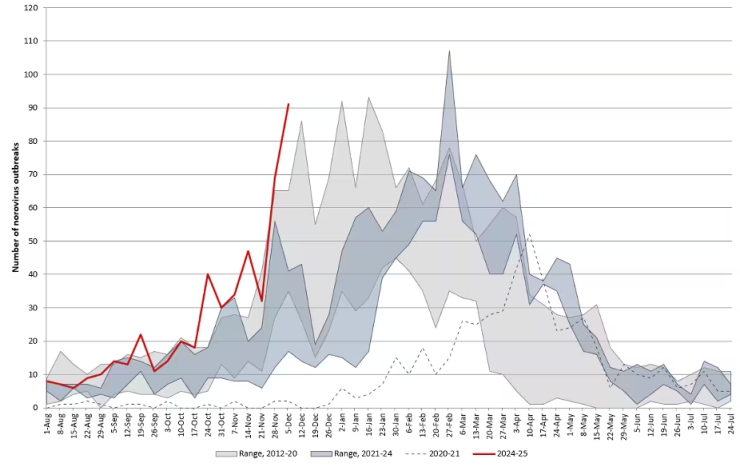
Number of Suspected or Confirmed Norovirus Outbreaks Reported by NoroSTAT-Participating States Per Week, 2012–2025
Data is everywhere—including the nightly news. Source: CDC
Introduce techniques incrementally, so students build a foundation for the more complex challenges they'll face on the CAST.
2. Integrate Data Throughout the Curriculum
Don't save data analysis for test prep season. When exploring any phenomenon, treat data as an "at-the-ready" tool. Introduce graphs, charts, tables, and maps wherever they fit. Give students opportunities to work with raw data—whether from their own investigations or existing sources. Most importantly, get them comfortable with "data moves": shifting formats (graph to table), combining datasets, and drawing conclusions.
Student presentations are powerful here. There's nothing quite like watching a student present their first pie chart to classmates, realizing in that moment: I am a scientist.
3. Practice with Purpose
Demystify the language and format of the CAST early. Many teachers make data analysis test prep a weekly practice, pulling sample questions and converting them to Google Forms for easy access. Start with standalone questions and single data sets, then move to question clusters requiring more sophisticated reasoning.

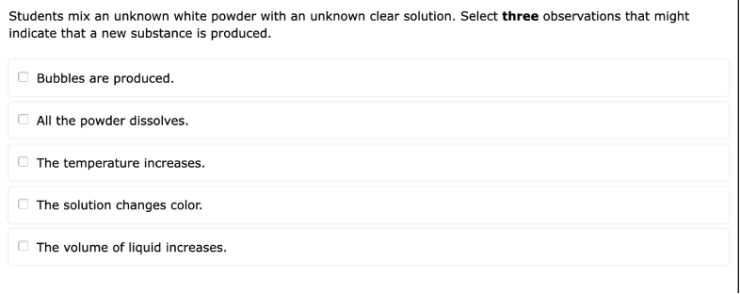
CAST questions ask students to interpret data tables and reason through experimental design.
Here's what to know about how the CAST handles data: questions present information in varied formats (graphs, sentences, tables), often centered on a phenomenon. Students must use data to draw conclusions, make predictions, and reason across multiple representations. The more familiar that format feels, the more confident students will be.
4. Track Progress and Adjust
As students advance, assess their mastery of specific components. Are they translating data between formats? Struggling with data-based reasoning? Use homework, presentations, and practice tests to identify gaps, then adjust your pacing. When test time arrives, you want every student feeling prepared—not surprised.
The goal isn't just test scores. It's building the kind of data literacy that serves students long after they leave your classroom.
Looking for ready-made practice questions aligned to the CAST? Download free data analysis question sets.
Tags
Save | Print | Email Article

Related Articles


From time to time CASE receives contributions from guest contributors. The opinions and views expressed by these contributors are not necessarily those of CASE. By publishing these articles CASE does not make any endorsements or statements of support of the author or their contribution, either explicit or implicit. All links to outside sources are subject to CASE’s Disclaimer Policy.