

Exploring Extreme Heat with Understanding Global Change
By Alec Barron, EdD, San Diego Science Project, UC San Diego
At the 2025 CASE Conference in Palm Springs, I had the opportunity to share how teachers across California can leverage freely available satellite data to anchor meaningful, NGSS-aligned investigations for students in grades 5-12.
The anchoring phenomenon centers on an observable pattern: satellite imagery reveals that two locations within the same community—sometimes just blocks apart—can differ in land surface temperature by 10-20 degrees or more. Using the Ecohydrology and Heat Explorer (EHE) from UC San Diego’s SoCal Heat Hub, teachers can access Land Surface Temperature (LST) data for any California community. Students examine maps, compare them with satellite imagery, and immediately notice patterns—the blacktop is hot, vegetated areas are cooler, and urbanized neighborhoods often experience significantly higher temperatures than surrounding areas.
This work comes from the SoCal Heat Hub at Scripps Oceanography, UC San Diego, funded through a Coastlines and People grant from the National Science Foundation. The UC San Diego Science Project has partnered with teacher leaders across our region to develop curriculum resources that transform this research into classroom-ready learning sequences. Central to our approach is the Understanding Global Change (UGC) framework from UC Berkeley, which provides students with tools to construct explanatory models that connect human activities, Earth systems, and measurable outcomes.
What makes land surface temperatures particularly powerful as an anchoring phenomenon is its adaptability across grade levels and content areas. Fifth-grade students in San Diego Unified piloted our Cooler Communities unit, using IR thermometers to collect temperature data around their school, then designing solutions to reduce heat on their campus. Middle school teachers have extended this work by integrating Micro:bit programming, allowing students to build sensor networks and analyze data patterns. High school chemistry teachers are using Urban Heat Islands to explore energy transfer and material properties, while biology teachers connect vegetation and homeostasis.
As students investigate land surface temperature differences, they naturally generate questions that lead to deeper inquiry. The EHE provides Normalized Difference Vegetation Index (NDVI) data—essentially a measure of "greenness"—that students use as evidence to refine their explanatory models. Through this process, learners develop systems thinking skills applicable to any future phenomena.
Teachers interested in bringing these resources to their classrooms are invited to join us at the Climate Champions Design Summit, June 9-10, 2026 at UC San Diego. Participants receive a $300 stipend and a free Understanding Global Change modeling kit for their students. Over two days, you'll experience the learning sequence firsthand, explore curriculum resources developed with the SoCal Heat Hub, and design implementation plans for your own context.
Whether you teach elementary, middle, or high school science, the summit equips you to support students in constructing evidence-based explanations using the UGC framework—skills that transfer to any unit of instruction.
For more information and registration, visit the San Diego Science Project website at sdscienceproject.org.
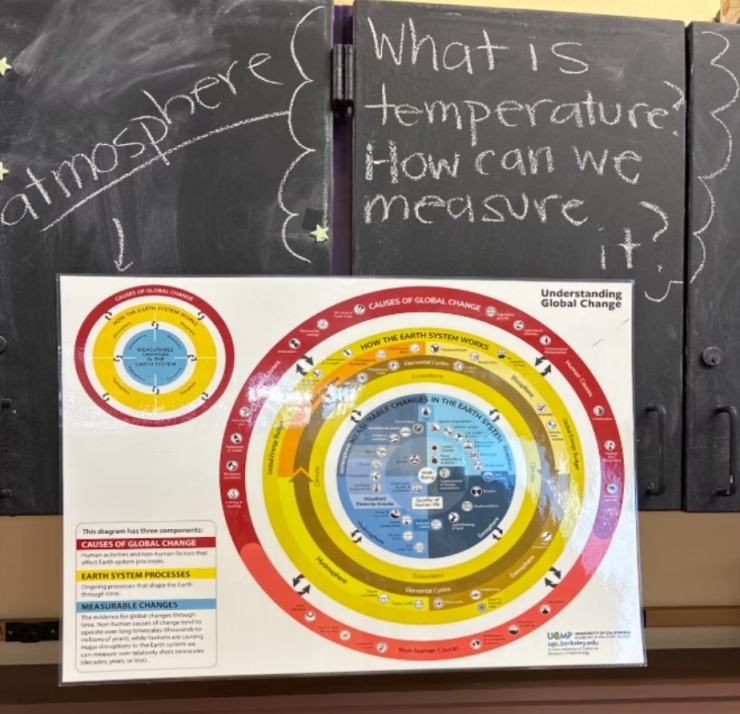
The Understanding Global Change infographic, which teachers and students use to support explanatory modeling work with the framework.
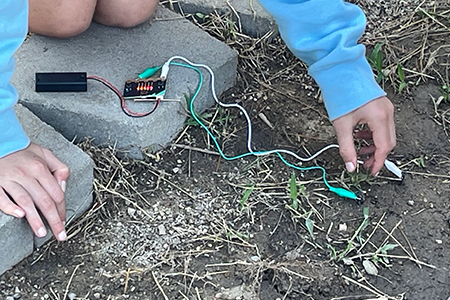
Students programming micro:bits to collect data on sunlight intensity, air temperature, and soil moisture across a campus to design solutions for extreme heat.
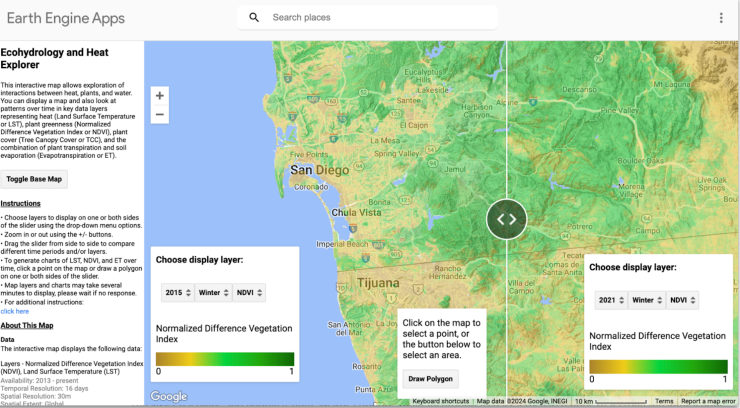
The Ecohydrology and Heat Explorer that teachers and students can use to generate maps of data on Land Surface Temperature (LST) and Normalized Difference Vegetation index (NDV).
Tags
Save | Print | Email Article

Related Articles


From time to time CASE receives contributions from guest contributors. The opinions and views expressed by these contributors are not necessarily those of CASE. By publishing these articles CASE does not make any endorsements or statements of support of the author or their contribution, either explicit or implicit. All links to outside sources are subject to CASE’s Disclaimer Policy.