Sweet Science: Exploring Complex Mixtures with Biotechnology
Dec 14, 2023
editor
By Danielle R. Snowflack, Ph.D. , Senior Director of Education at Edvotek, Inc.
Our workshop presented at the 2023 California Science Education Conference focused on the analysis of food dyes using paper chromatography and agarose gel electrophoresis (slides and full video tutorial available). In this article, we expand on the chromatography component and provide additional activities for use with the lesson. This experiment links art, chemistry, physics, mathematics, and food science in a fun and engaging way, and can be aligned to the NGSS or your school curriculum.
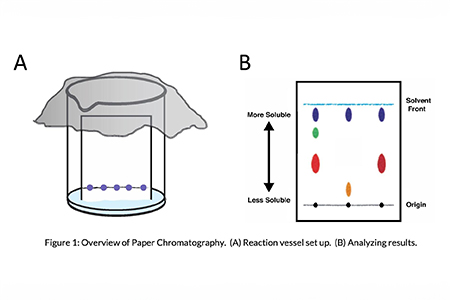
Chromatography is a separation technique used to isolate components in a mixture based on their interactions with stationary and mobile phases. The stationary phase provides a solid support for component separation. Samples are applied to this support, and the mobile phase is flowed over the surface, moving the molecules. In paper chromatography, the stationary phase is a piece of filter paper. Samples are applied to the paper, which is then placed in a beaker containing an alcohol or salt solution. This mobile phase wicks up the solid support of the paper, carrying the dye molecules with it. Each molecule moves at a different rate based on the chemical and physical interactions with the stationary and mobile phase. By analyzing the distance traveled by each molecule versus the distance traveled by the mobile phase, students can calculate the retention factor (Rf) of each food dye.
You will need:
Candy: We recommend Skittles, M&M’s, or gumballs.
Stationary phase: Whatman #1 filter paper.
Mobile phase: Solutions of isopropyl alcohol and water.
Reaction vessel: Clear plastic cups or beakers.
Spotters: Micropipettes, transfer pipettes or toothpicks.
Plastic wrap to cover the reaction vessel.
A small plastic cup and water for dissolving the dye.
A pencil and a ruler.
Experimental Protocol (Figure 1):
PLACE candy in a small cup with 100 uL water. SWIRL the candy in the cup to dissolve the color.
CUT the filter paper into a rectangle that fits into your reaction vessel.
Using a pencil and ruler, MARK the baseline 1 cm from the bottom of the paper. DO NOT use ink because it will migrate during chromatography.
Using a spotter, TRANSFER a small amount of dye to the baseline of the paper. REPEAT with all samples. Let dry for five minutes.
POUR alcohol solution into the reaction vessel.
STAND the filter paper in the vessel so that the bottom is touching the solvent. COVER the vessel with plastic wrap to prevent evaporation.
ALLOW the solvent to flow through the paper until it is 1 cm from the top. Using your pencil, gently MARK the solvent front and CIRCLE the food dye spots.
Using the ruler, MEASURE the distance each dye traveled from the baseline. MEASURE the distance the solvent traveled from the baseline.
CALCULATE the Rf by dividing the distance the dye traveled by the distance the solvent traveled.
Extension activities:
Dye separation is influenced by changing the stationary and mobile phases. Try various papers and solvent systems to see how the results change. Options for the stationary phase include paper towels, coffee filters, or other filter papers, while the mobile phase can consist of ethanol or sodium chloride solutions.
Incorporate STEAM through color theory, the study of how colors mix and the visual impact of specific color combinations. Perception of colors are influenced by hue, value, saturation, and surrounding colors. Students can explore the use of color in food products and in packaging design.
Visualizing different colors involves additive and subtractive processes. Additive colors combine colored light (e.g., LCDs), while subtractive colors remove colors from white (e.g., paint). Using this experiment as a starting point, discuss wavelengths of light and the additive and subtractive color models.
The human eye perceives color by detecting light wavelengths through cones in the retina sensitive to red, green, and blue. The brain processes these signals to create a spectrum of colors. Color Blindness, an inherited condition, impairs accurate color perception in certain cones. Students can research the retina's structure, the genetics of color blindness, and their own color perception.
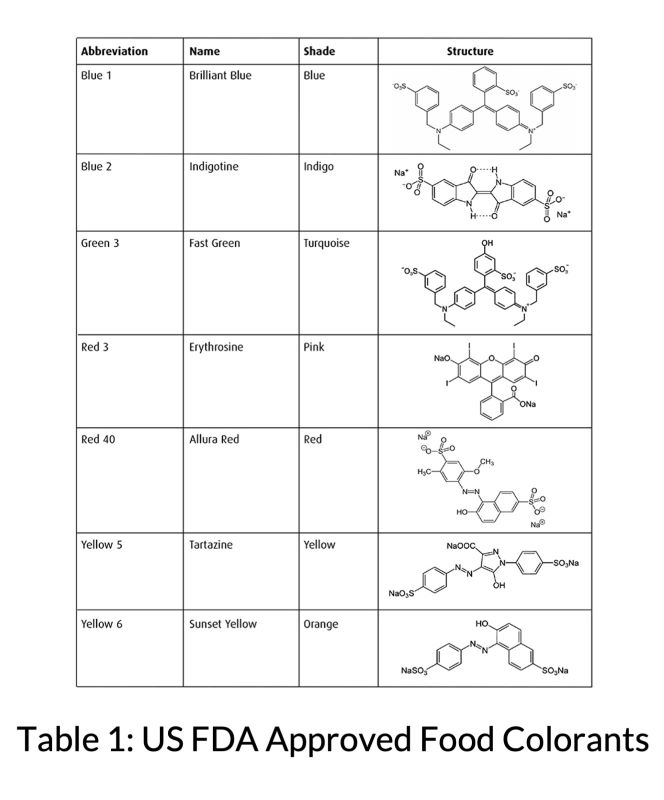
The Food and Drug Administration (FDA) approved seven food dyes for human consumption (Table 1). This limited palette of dyes are combined to create the colors we see in candy. Using the ingredients listed on food packaging and knowledge of color mixing, have students make hypotheses about dye combinations and then prove them with chromatography.
Research the career of food scientists, who are researchers that merge flavors, nutrition, and innovation to enhance foods. This field integrates agricultural and nutritional sciences with microbiology and biochemistry. Food scientists contribute to regulatory affairs, food safety, and sustainability efforts.
About the Author:
Danielle R. Snowflack, Ph.D.
Danielle R. Snowflack, Ph.D. is the Senior Director of Education at Edvotek, Inc. Dr. Snowflack is a first-generation college student and scientist who has been dedicated to improving science education and increasing participation in the sciences. She earned her Ph.D. in Molecular Biology from Princeton University in 2012, where she studied the mechanisms of translational control in fruit flies. From 2012 to 2017, Dr. Snowflack worked at Edvotek Inc. in several roles, including as the Director of Education. In 2017, she joined the American Society of Biochemistry and Molecular Biology (ASBMB) where she supported scientists throughout their careers through initiatives in outreach, professional development, and diversity/inclusion. In November 2019, Dr. Snowflack returned to Edvotek to continue her work in biotechnology education. While at Edvotek, she created several hands-on science experiences for educators, revitalized the teacher professional development workshop program, and created a comprehensive series of teaching resources, including videos, literature, and lesson plans.
From time to time CASE receives contributions from guest contributors. The opinions and views expressed by these contributors are not necessarily those of CASE. By publishing these articles CASE does not make any endorsements or statements of support of the author or their contribution, either explicit or implicit. All links to outside sources are subject to CASE’s Disclaimer Policy.